
In the fast-paced world of stock trading, knowing market patterns is key to success. But what are these patterns, and how can they help you in the markets? This guide will explore the world of stock market patterns. It will teach you how to spot opportunities and manage risks.
Ever wondered how pro traders find winning trades? They use stock chart patterns. These patterns, made by price changes, are the heart of technical analysis. Learning to see and understand these patterns can give you an edge in the markets.
Key Takeaways
- Patterns are the foundation of technical analysis, revealing the dynamics of market trends and sentiment.
- Trendlines help identify support and resistance levels, guiding traders in their entry and exit decisions.
- Continuation patterns like pennants, flags, and triangles signal the potential for the prevailing trend to continue.
- Reversal patterns like head and shoulders and double tops/bottoms indicate a shift in the underlying market direction.
- Mastering pattern recognition is a crucial skill for traders seeking to make informed, data-driven decisions.
Understanding Stock Chart Patterns
Stock chart patterns are unique shapes made by price movements on a chart. They are key to technical analysis. By spotting these patterns, traders can guess where prices might go next. Trendlines are important for finding these patterns, showing where prices might stop or start.
Patterns as the Foundation of Technical Analysis
Technical analysts use stock chart patterns to spot trends and make smart trades. These patterns show what market players are thinking, revealing the fight between buyers and sellers. By knowing these patterns, traders can guess future price changes and grab new chances.
Identifying Patterns Using Trendlines
Trendlines are vital for spotting chart patterns. Drawing the right trendlines helps traders find key price levels. These levels are crucial for understanding price behavior. The right price points are key to correctly reading these patterns.
« Understanding stock chart patterns is a fundamental aspect of technical analysis, as these distinctive formations can provide valuable insights into market sentiment and potential price movements. »
Learning to spot and understand stock chart patterns can make traders better. It helps them make smarter choices and boosts their success in the stock market.
Continuation Patterns
In the stock market, traders watch for continuation patterns closely. These patterns show a short pause in a trend, hinting it will continue. Knowing these patterns helps investors catch the trend’s next move.
Triangles, Flags, and Pennants
Triangles, flags, and pennants are key patterns. Triangles have different types, each with its own meaning. Flags and pennants are short and steep, showing a brief trend pause.
Wedges and Rectangles
Wedges and rectangles are also part of continuation patterns. Wedges can be ascending or descending. Rectangles, or trading ranges, show a market pause. These patterns help traders understand the market’s mood and the trend’s future.
Spotting these patterns is key in technical analysis. They help traders find the best times to buy or sell. By knowing these patterns and other indicators, investors can make smarter trades and follow market trends.
| Pattern | Description | Trend Continuation Implications |
|---|---|---|
| Triangles | Converging trendlines forming a triangle shape | Ascending, descending, or symmetrical triangles can signal continuation of the existing trend |
| Flags | Parallel trendlines forming a rectangular shape | Flags typically indicate a brief pause in the trend before it resumes |
| Pennants | Converging trendlines forming a small triangle shape | Pennants are short-lived patterns that suggest the continuation of the prior trend |
| Wedges | Converging trendlines forming a sloping triangle shape | Ascending wedges may signal a bullish continuation, while descending wedges may indicate a bearish continuation |
| Rectangles | Parallel trendlines forming a horizontal trading range | Rectangles represent a pause in the trend, often leading to a continuation of the previous direction |
By recognizing these continuation patterns, traders can better navigate the stock market and identify opportunities to capitalize on trend continuation in their technical analysis strategies.
« Mastering the art of identifying and interpreting continuation patterns is a cornerstone of successful technical analysis in the financial markets. »
Reversal Patterns
In the world of stock trading, spotting key reversal patterns is key. These patterns show when the market’s direction might change. By learning to spot these, traders can make smarter choices and predict market shifts.
Head and Shoulders Pattern
The head and shoulders pattern is a well-known reversal sign. It has three peaks, with the middle peak being the highest. The pattern ends when the price drops below the « neckline, » showing a possible shift from up to down.
Double Tops and Double Bottoms
The double top and double bottom patterns are also important. A double top happens after a long rise, when the price can’t go past a certain level twice. This signals a possible downturn. On the other hand, a double bottom occurs after a long fall, when the price can’t go below a certain level twice. This hints at a possible upturn.
Knowing how to read these reversal patterns is crucial for traders. They help predict when the market might change direction. By using these patterns in their analysis, investors can spot new chances and stay ahead in the market.
stock market patterns
Identifying bullish and bearish patterns is key in the stock market. These patterns give insights into the mood and future price moves of an asset. By knowing these patterns, traders can make smart choices and spot trends early.
Bullish Patterns
Bullish patterns show a trend going up or continuing to rise. Some common ones are:
- Ascending Triangle: It has a flat top and a rising bottom, hinting at a big move up.
- Cup and Handle: It’s a two-part shape with a rounded bottom and a pullback, showing a strong trend.
- Inverted Head and Shoulders: This pattern has a high low and two low lows, predicting a trend change to up.
Bearish Patterns
Bearish patterns point to a trend going down or a possible change. Key bearish patterns are:
- Head and Shoulders: It has a high high and two low highs, hinting at a trend change to down.
- Double Top: It’s two peaks with a dip in between, signaling a possible down turn.
- Descending Triangle: It has a flat bottom and a falling top, suggesting a possible drop.
Interpreting Pattern Breakouts and Breakdowns
When a pattern breaks out or breaks down, it’s a big deal. A bullish breakout means the price goes above a resistance level, starting a new up trend. A bearish breakdown means the price goes below a support level, starting a down trend. Traders watch these closely to find the best times to buy or sell.
« Understanding and recognizing bullish and bearish patterns is a fundamental skill for any technical analyst or active trader in the stock market. »
Trend Identification Techniques
Identifying trends is key for traders wanting to match their strategies with the market’s direction. They look at support and resistance levels, price movements, and trading volume. This helps them spot trends and grab new opportunities.
Support and Resistance Levels
Support and resistance levels are key points on a price chart. They act as barriers that shape the stock’s price. By finding these levels, traders get clues on market sentiment and trend direction.
They use trendlines, chart patterns, and technical indicators to find these important zones.
Price Action and Volume Analysis
Price action is studying a stock’s price changes over time. It’s a core part of technical analysis. By looking at price patterns, traders can spot trends and predict reversals.
Volume analysis looks at trading activity and liquidity. It supports price movements and shows trend confirmation.
| Trend Identification Technique | Description | Key Benefits |
|---|---|---|
| Support and Resistance Levels | Identifying key price levels that act as barriers to a stock’s upward or downward movement | Helps predict trend continuation or reversal, provides entry and exit points |
| Price Action Analysis | Studying the patterns and movements of a stock’s price over time | Enables the identification of trends, potential reversals, and trading opportunities |
| Volume Analysis | Examining the trading activity and liquidity of a stock | Confirms price movements and provides insights into market sentiment |
By learning these techniques, traders can better navigate the stock market. They can seize new opportunities.
Candlestick Patterns and Formations
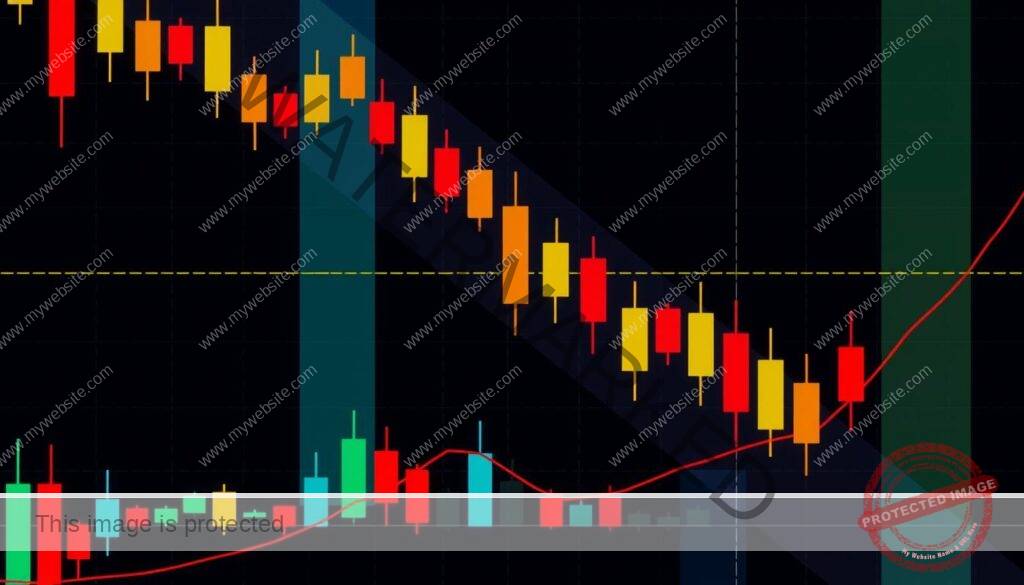
Candlestick charts are key in technical analysis, helping traders spot trends and price changes. They started in Japan over 100 years ago. Now, they’re a must-have on most online trading sites.
These charts show four important prices: open, close, high, and low. Traders use these to understand market feelings and trends. Patterns are split into bullish and bearish, showing if prices might go up or down.
Common Bullish Candlestick Patterns
- Hammer
- Inverted Hammer
- Bullish Pin Bar
- Morning Star
- Bullish Engulfing
- Three White Soldiers
- Bullish Harami
- Tweezer Bottom
- Bullish Marubozu
Common Bearish Candlestick Patterns
- Bearish Pin Bar
- Evening Star
- Bearish Engulfing
- Three Black Crows
- Bearish Harami
- Dark Cloud Cover
- Bearish Marubozu
- Tweezer Top
- Hanging Man
Studies show candlestick patterns can make predictions more accurate. For example, a study on Taiwan’s Stock Exchange and Japan’s Nikkei 225 found better forecasting when combining these patterns with other indicators.
As traders delve deeper into candlestick patterns, technical analysis keeps growing. It offers essential tools for navigating the ever-changing stock market.
Trading with Chart Patterns
In the stock market, chart patterns are key for making smart decisions. Traders who know how to use these patterns can gain valuable insights. This helps them make successful trades. We’ll look at how to use chart patterns, including entry and exit strategies and managing risk.
Entry and Exit Strategies
Chart patterns help find the best times to buy or sell. By studying patterns like pennants, flags, wedges, and triangles, traders can spot when trends might change. This helps them time their trades better.
Understanding these patterns and their past success can guide traders. It helps them avoid making trades too early or too late.
Risk Management Considerations
Managing risk is vital in trading, and chart patterns are no different. Traders need to think about support and resistance levels, price action, and volume analysis when setting stop-loss orders and deciding how much to trade. Using disciplined risk management techniques helps protect their money and deal with market ups and downs.
To use chart patterns well, traders need to know technical analysis and risk management. By combining these, they can make the most of chart patterns. This leads to consistent success in the stock market.
« The key to successful trading is to recognize patterns and capitalize on them before the masses. »
Combining Indicators and Patterns

In technical analysis, using chart patterns with other indicators is key. It offers a deeper look into the market. This way, traders can spot trends, reversals, and good trading chances.
Moving Averages and Volume Analysis
Moving averages smooth out price changes, showing the trend. Adding volume analysis gives more insight into market strength. This combo helps traders follow trends, spot reversals, and understand market momentum.
Oscillators and Momentum Indicators
Oscillators like RSI and Stochastic Oscillator add to chart patterns. They show price movement speed and change. This helps traders find overbought or oversold spots and support or resistance levels.
Using technical indicators and chart patterns well needs understanding their strengths and limits. Traders should test different combinations to find the best strategy. This approach helps traders see the market better and make more profitable choices.
« The integration of chart patterns with other technical indicators can provide a more holistic and robust approach to market analysis and trading decision-making. »
Algorithmic Trading and Backtesting
Technology has changed the financial markets a lot. Now, algorithmic trading is everywhere. It uses data and analysis to find and use market trends. This method is popular with big investors and even some individual traders.
Backtesting is key to algorithmic trading. It tests trading strategies with old market data. This helps traders see how well their plans work and make them better.
Algorithmic trading systems can make trades fast, in milliseconds. They need real-time data and cloud computing to work. Backtesting tools help traders see how their strategies would have done in the past.
Algorithmic trading tries to avoid emotional mistakes. It uses computers to make trades quickly and efficiently. This can lead to lower costs and faster responses to market changes.
There are many types of algorithmic trading. These include following trends, arbitrage, and rebalancing index funds. They use data and models to find good opportunities in the market.
But, algorithmic trading has its downsides. It can cause market problems, rely too much on tech, and lead to more volatility. There’s also worry about too much control by computers and not enough by humans. Still, tech and data analysis keep improving, which will help algorithmic trading grow.
The Role of Market Psychology
The stock market is always changing, and knowing both numbers and feelings is key to success. Chart patterns give us clues, but market psychology is just as important. This part looks at how feelings and group actions shape stock market trends. It shows why we need to look at both numbers and feelings when trading.
Investor Sentiment and Herd Behavior
Market psychology is vital in understanding stock market moves. Feelings like greed and fear greatly affect how investors decide. These emotions can sometimes lead to unexpected price changes.
Hedge funds and algorithmic traders use strategies based on market trends. Famous economists like Tversky and Kahneman have shown how feelings impact prices. They questioned the idea that markets always make sense.
Knowing about market psychology helps traders spot patterns like herding and panic selling. By seeing when the market is too high or too low, traders can make smart moves. They can use these moments to their advantage.
Market psychology matters for all kinds of investments, not just stocks. Tools like the VIX help measure how scared or excited the market is. This information can guide traders.
In short, market psychology is crucial in the stock market. By understanding what investors feel and do, traders can better navigate the market. This helps them make smarter choices.
« Market psychology encompasses a wide range of emotions and behaviors exhibited by investors, including fear, greed, optimism, pessimism, herd mentality, and risk aversion. »
Conclusion
This guide has covered the key stock market patterns, trends, and technical analysis methods. These tools help traders make better and more profitable choices. By knowing how to spot and use chart patterns, trendlines, and indicators, traders can tackle the stock market’s challenges.
As the market changes, it’s important to understand how data and psychology work together. This knowledge helps traders find new chances and manage risk well.
Learning from trading strategies and market trends is crucial for traders. It helps them improve their algorithmic trading and decision-making. By combining technical and fundamental analysis with market psychology, traders can aim for lasting success in the stock market.
The ability to spot and use stock market patterns is vital for market success. Staying alert, adapting, and being disciplined are key. These steps help traders thrive in the constantly shifting stock market world.